Green Monday Surges 15 Percent to $1.6 Billion in Desktop Sales to Rank as 3rd Heaviest Day of the Holiday Season-to-Date
Five $1 Billion Dollar Online Shopping Days Highlight Strong Cyber Week, with Similar Results Expected for Current Week
Online Sales Since Thanksgiving Up a Very Strong 18-Percent Y/Y vs. 13 Percent Prior to the Holiday
RESTON, VA, December 10, 2014 – comScore (NASDAQ : SCOR), a leader in measuring the digital world, today reported holiday season U.S. retail e-commerce spending from desktop computers for the first 38 days of the November-December 2014 holiday season. For the holiday season-to-date, $35.4 billion has been spent online, marking a 15-percent increase versus the corresponding days last year. Green Monday (Dec. 8) reached $1.6 billion in desktop online spending, up 15 percent versus year ago, representing the third heaviest online spending day of the holiday season-to-date after Cyber Monday and Tuesday, December 2.
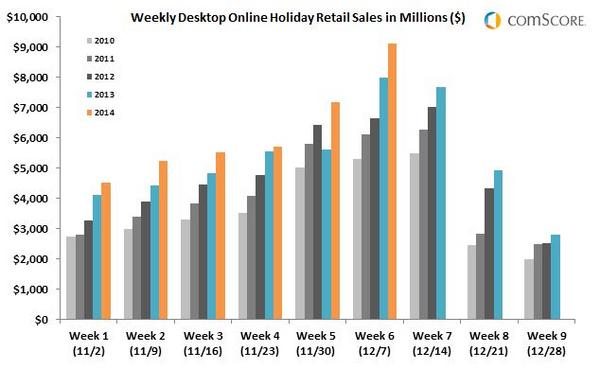
Cyber Week, the week beginning with Cyber Monday, posted strong growth online, raking in $9.1 billion in desktop spending for an increase of 14 percent compared to the same week last year. This marked the second time ever, and the first time this season, that boasted the accomplishment of having five billion dollar days during the work week, totaling $7.3 billion during that period. Also noteworthy is that sales growth has picked up drastically since Thanksgiving, with online spending on desktop up a very strong 18-percent year-over-year, compared to an increase of 13 percent for the period of November that preceded Thanksgiving.
| 2014 Holiday Season To Date vs. Corresponding Days* in 2013 Non-Travel (Retail) E-Commerce Spending Excludes Auctions and Large Corporate Purchases Total U.S. – Home & Work Desktop Computers Source: comScore, Inc. | |||
| Millions ($) | |||
| 2013 | 2014 | Percent Change | |
| Nov. 1–Dec. 8 (vs. Nov. 2-Dec. 9, 2013) | $30,768 | $35,449 | 15% |
| Pre-Thanksgiving (Nov. 1-26 vs. Nov. 2-27, 2013) | $17,831 | $20,181 | 13% |
| Thanksgiving thru Green Monday | $12,937 | $15,268 | 18% |
| Thanksgiving Day (Nov. 27) | $766 | $1,009 | 32% |
| Black Friday (Nov. 28) | $1,198 | $1,505 | 26% |
| Holiday Weekend (Nov. 29-30) | $1,594 | $2,012 | 26% |
| Cyber Monday (Dec. 1) | $1,735 | $2,038 | 17% |
| Thanksgiving thru Cyber Monday | $5,293 | $6,564 | 24% |
| Cyber Week (Dec. 1-7) | $7,978 | $9,126 | 14% |
| Cyber Week Mon-Fri (Dec. 1-5) | $6,315 | $7,287 | 15% |
| Cyber Weekend (Dec. 6-7) | $1,663 | $1,840 | 11% |
| Green Monday (Dec. 8) | $1,401 | $1,615 | 15% |
*Corresponding days based on corresponding shopping days (November 2 thru December 9, 2013)
“Online holiday commerce continues to perform very well through Green Monday with nine days surpassing $1 billion in desktop spending and a 15-percent growth rate versus last year, one point ahead of our forecasted growth rate for the entire season,” said comScore chairman emeritus Gian Fulgoni. “Though much has been made in the media of the possibility that early retailer promotions might have pulled spending away from the key shopping days such as Black Friday and Cyber Monday, our data show that this did not occur. In fact spending growth prior to Thanksgiving stood at 13 percent, while we’ve seen it climb to 18 percent during the period of Thanksgiving through Green Monday, with the key spending days all seeing above average growth rates.”
Mobile Accounts for More than 20 Percent of Online Buying on Key Shopping Days
Recently compiled comScore data also reveals that mobile commerce has been an important component of total digital commerce on the key shopping days. Mobile buying using smartphones and tablets accounted for $361 million of spending on Thanksgiving (26 percent of total digital commerce), $436 million on Black Friday (22 percent) and $548 million on Cyber Monday (21 percent).
Recently compiled comScore data also reveals that mobile commerce has been an important component of total digital commerce on the key shopping days. Mobile buying using smartphones and tablets accounted for $361 million of spending on Thanksgiving (26 percent of total digital commerce), $436 million on Black Friday (22 percent) and $548 million on Cyber Monday (21 percent).
| Key Shopping Days in 2014 Holiday Season: Desktop vs. Mobile Spending Non-Travel (Retail) Total Digital Commerce Spending Excludes Auctions and Large Corporate Purchases Total U.S. – Home & Work Desktop Computers, Smartphones, Tablets Source: comScore E-Commerce and M-Commerce Measurement | ||||
| Day | Spending ($ Millions) | Mobile as % of Total Digital | ||
| Total Digital | Desktop | Mobile | ||
| Thanksgiving (Nov. 27) | $1,370 | $1,009 | $361 | 26% |
| Black Friday (Nov. 28) | $1,941 | $1,505 | $436 | 22% |
| Cyber Monday (Dec. 1) | $2,585 | $2,037 | $548 | 21% |
Weekly Online Holiday Retail Sales

No comments:
Post a Comment